How to Use Top Command in Linux
Introduction
If you are a user, developer or system administrator then you must have enough knowledge on how to use top and htop command. The top is a command-line utility in Linux-based operating systems that can be used to display information about the top CPU processes and memory utilization. It displays the processor activity of your Linux system and tasks managed by kernel in real-time.
The Htop is a real-time process monitoring tool for Linux-based operating systems. It is very similar to top command, however, it has some other user-friendly features that are not available in top command. The htop command allows you to monitor the system resources and processes in real-time. It also supports mouse operation, various color schemes and gives visual indications of memory and processor usage. Usually, it is used to displays crucial system information such as, uptime, memory utilization, load average and many more.
In this tutorial, we will show you how to use top and htop command in Linux.
Top Command Usage with Examples
By default, the top comes pre-installed in all Linux-based operating systems. In this section, we will show you how to use top command with examples.
Launch Top Command Interface
Open your terminal and run the top command as shown below:
top
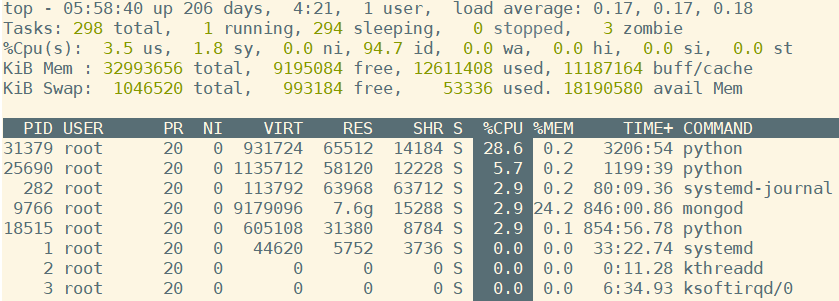
You should see the top interface something like this: 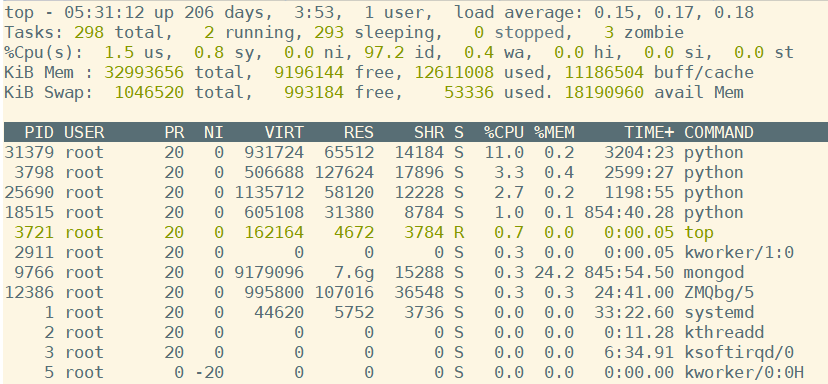 In the above screen, you should see the statistics of processes, resource usage and a list of the currently running processes. You can press q to exit from the top interface.
A brief explanation of each column names are shown below:
- PID : Displays the unique process ID.
- USER : The user name of the owner of a task.
- PR : It shows the priority of the task.
- NI : It shows the nice value of the task.
- VIRT : It shows the total virtual memory used by the task.
- RES : It shows the amount of RAM currently used by the process.
- SHR : It shows the amount of shared memory used by a task.
- %CPU : It shows the CPU usage.
- %MEM : It shows the memory usage.
- TIME+: It shows the total cpu time used by the task in hundredths of a second.
To get help on how to use a top command, press ? or h after running the top command. You should see the following screen:
Working with Top
First, run the top command by typing top and then enter.
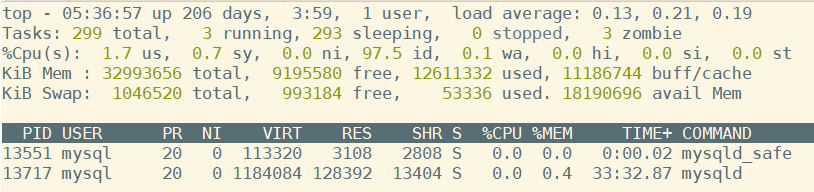
How to display processes by specific user
To display a specific User process details, press u, type the user name (example mysql in my snapshot below) and hit Enter.
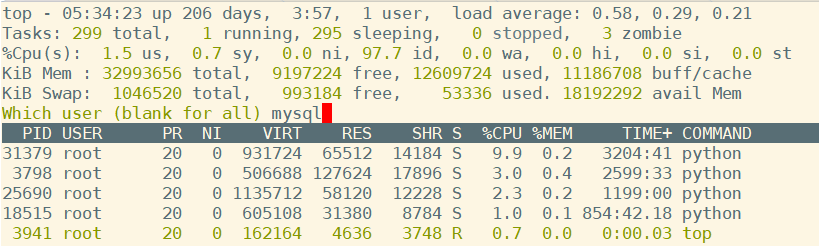
You should see the following screen:
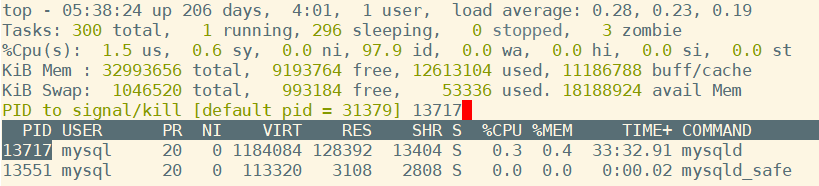
How to kill a process using top
To kill a process, press k, type process id and hit Enter as shown below: After that process 13717 will be killed.
How to display all running processes using top
To display all running process in color just press z button as shown below: 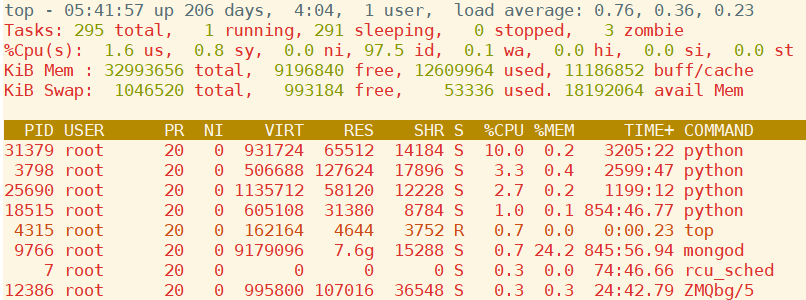
How to sort the processes by memory using top
To sort the process list by memory usage just press M (shift+m) key as shown below: You would see processes sorted by biggest to smallest memory foot print. 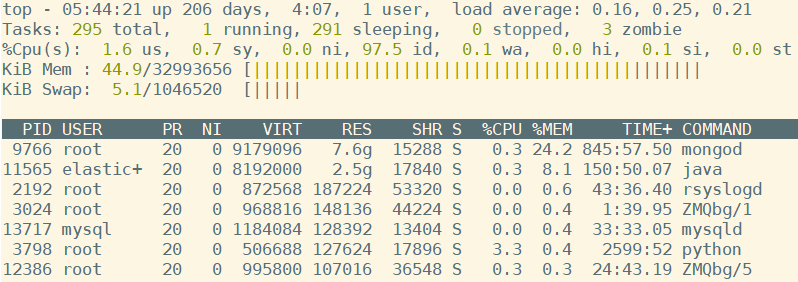
How to sort the processes by CPU usage using top
To sort the process list by CPU usage just press P(shift +p) key as shown below: 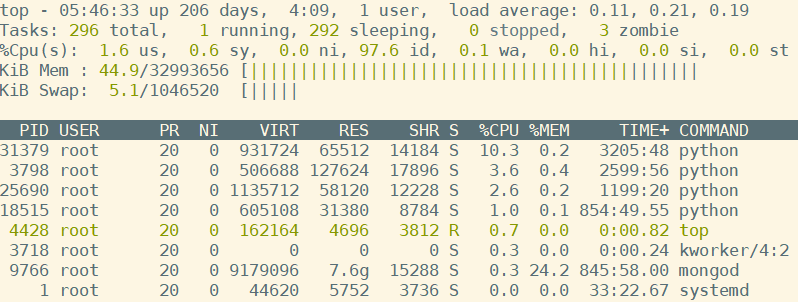
How to sort the processes by id using top
To sort the list by process id just press N key
How to sort the processes by running time using top
To sort the list by the running time just press T key as shown below:
By default, the sorting is done in descending order. For each of the above commands, You can press R (shift+r) to display the output sorted in ascending order.
How to highlight a sorted column in top
You can press x to highlight the sorted column with bold text: Lets look at the highlighted cpu usage column sorted from highest to lowest usage. Press P (shift+p), then follow by x. You should see following output. (check cpu column)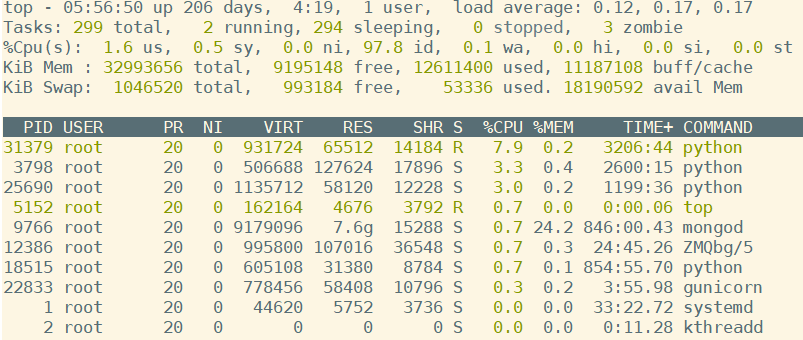
You can press b to highlight the sorted column background color: Here is the sequence to get the below output.
P(shift +p) follow by x follow by b
To display the full command path along with the command-line arguments just press the c key: 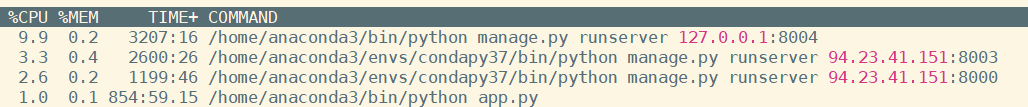 How to display parent child hierarchy of a process using top
To display the processes in a parent-child hierarchy mode just press the V key:
Conclusion
In the above tutorial, we learned how to use top command in Linux. I hope you can now easily use top command to perform your day-to-day tasks.